How Node.js Garbage Collection Works
How V8 manages memory in Node.js: the heap, generational GC, Scavenge vs Mark-Sweep-Compact, GC pauses, leaks, and when to tune.

In JavaScript, you never have to free up memory yourself. You create objects, use them, and the V8 JavaScript engine automatically cleans them up once your code doesn’t need them anymore. This automated cleanup process is called Garbage Collection (GC).
Most of the time, this happens invisibly. But when things go wrong, you might see slow response times, skyrocketing server costs, or the dreaded JavaScript heap out of memory crash.
You don’t need to be a V8 engine expert to fix these issues. You just need to understand where your data lives, how the garbage collector cleans it up, and how to spot when memory is getting stuck.
When Should I Care About This?
For small scripts or a normal API service, you can mostly ignore garbage collection—the defaults handle it well, and chasing it early is wasted effort.
Start paying attention when you see real symptoms in production:
- Memory keeps climbing and never settles back down.
- Your app crashes with a
JavaScript heap out of memoryerror. - Your p95/p99 latency randomly spikes for no obvious reason.
- Your container keeps getting restarted for going over its memory limit.
If any of these sound familiar, the rest of this post is for you. These are the exact problems garbage collection causes when it goes wrong—and knowing how it works is how you fix them.
Three Terms You Need to Know
Before we dive in, let’s define three concepts that will make the rest of this post much easier to understand:
- Heap: Think of this as a massive storage warehouse. When you create complex data whose size can change (like objects, arrays, or strings), it goes into the Heap. Example:
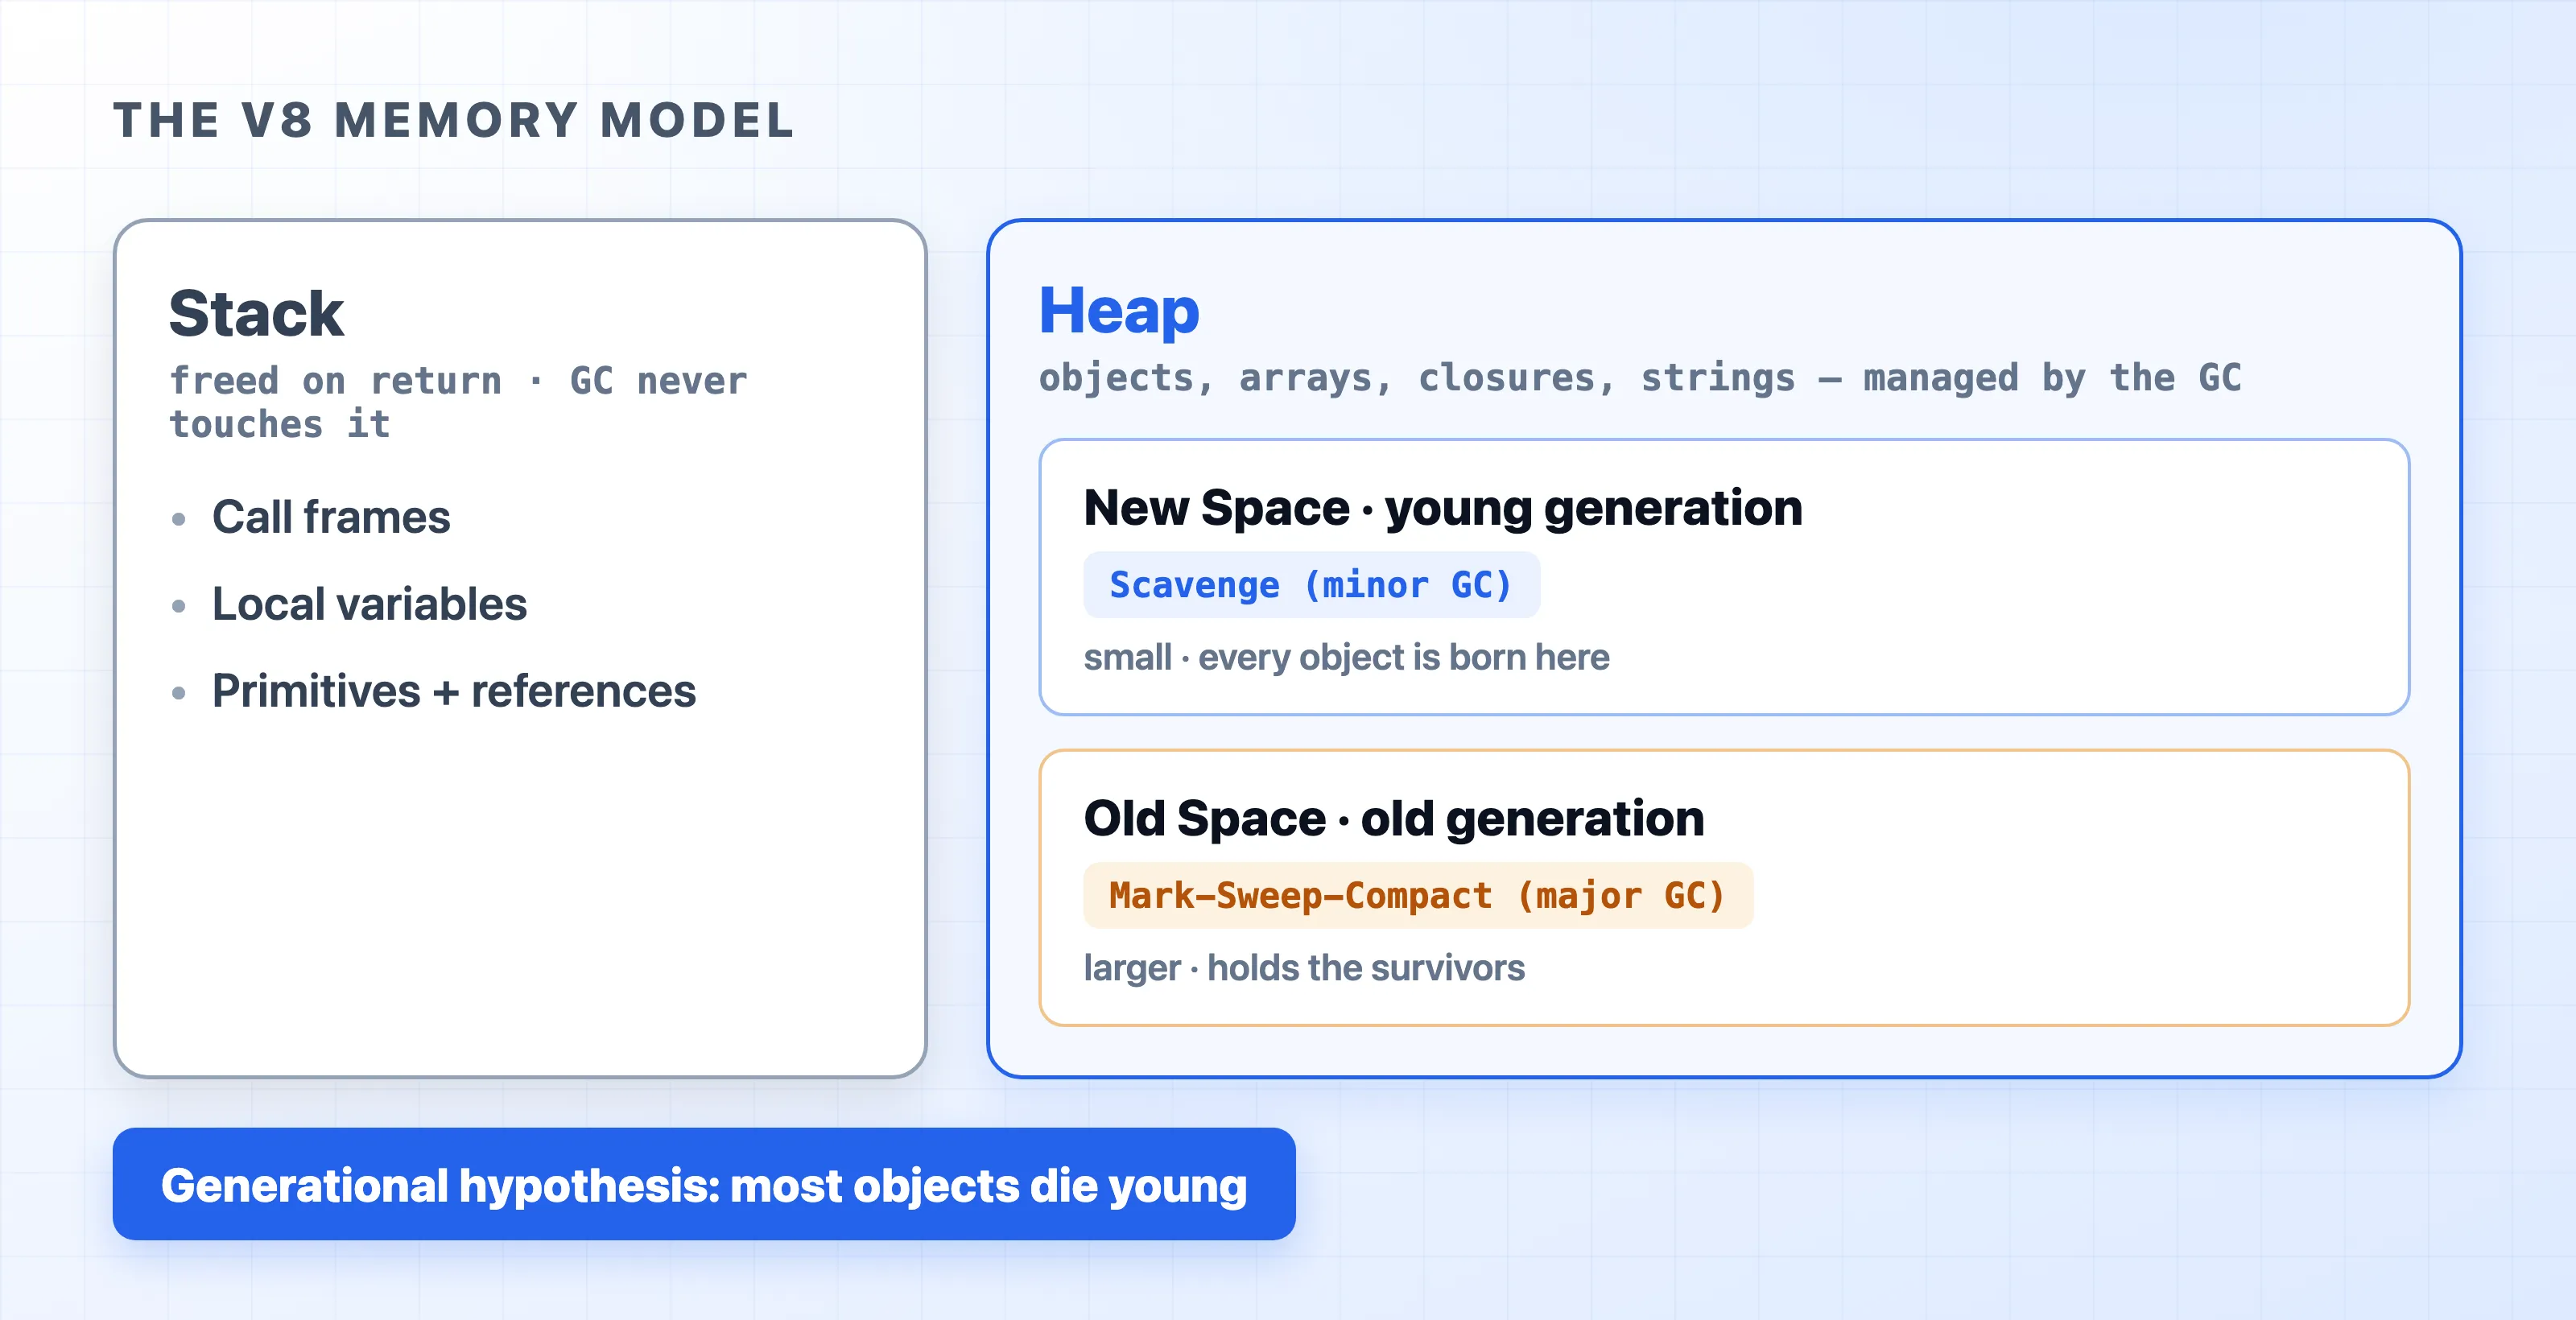
const user = { name: "Ada" }. The garbage collector only works in the Heap. - Generational GC: V8 engine operates on one simple rule: most objects die young. A quick API request might create 50 temporary objects that are useless a second later, while your database config object lives forever. V8 engine separates objects by age to clean up the temporary ones efficiently.
- Stop-the-world: When V8 engine needs to do heavy cleaning, it literally pauses your JavaScript execution. While time is “frozen,” your app cannot handle new requests or run timers. Short pauses are invisible; long pauses make your app feel slow and laggy.
Where Does Data Go? The Stack vs. The Heap
Your Node.js program uses two main areas of memory:
- The Stack: Think of this as a quick to-do list. It holds small, simple data (like numbers and booleans) and keeps track of function calls. As soon as a function finishes running, its part of the Stack is immediately erased. It’s incredibly fast, and the garbage collector never has to touch it.
- The Heap: This is the warehouse for everything else. Objects, arrays, and closures live here. Because the Heap gets messy, V8 engine divides it into two main sections:
- New Space (Young Generation): A small waiting room where all new objects are born. It gets cleaned constantly and rapidly.
- Old Space (Old Generation): A much larger long-term storage area. Objects that survive multiple cleanups in New Space get moved here. This area is cleaned less often because the process takes longer.
How Does the V8 Engine Know an Object Is “Alive”?
Before we talk about cleaning, we need to answer one question: how does the V8 engine decide an object is still in use? It doesn’t read your mind or count how often you use a variable. It uses one simple rule—can I still reach this object?
The V8 engine starts from a set of roots: things it knows are always alive. These are your global variables and the variables inside any function that’s running right now. From those roots, it follows every reference from one object to the next, like following links.
- If the V8 engine can reach an object by following references from a root, the object is alive.
- If nothing leads back to a root, the object is garbage—even if it still has data inside it.
Here’s the same idea in code:
function createUser() {
  const settings = { theme: "dark" };     // reachable while createUser runs
  const user = { name: "Ada", settings };  // user points to settings
  return user;
}

let activeUser = createUser(); // a root now points to user (and to settings)

// ...later, we're done with this user:
activeUser = null;             // the root lets go of user
While createUser runs, both objects are reachable. After it returns, settings would normally disappear—but user holds a reference to it, and activeUser (a root) holds user. So both stay alive.
The moment you run activeUser = null, nothing points to either object anymore. They become unreachable, and the next cleanup is free to delete them. Notice we used let, not const—a const root can never let go, so anything it points to stays alive for as long as that variable is in scope. That detail matters once we get to memory leaks.
That’s the whole game. An object is alive only as long as something alive still points to it. Both cleanup methods below are just fast ways of asking that one question.
Cleaning the New Space (the “Scavenge”)
Since most objects die young, the New Space fills up fast and needs to be cleaned constantly. V8 engine does this with a quick copy-and-clear trick. Its official name is Scavenge, but all it really does is copy the survivors out, then wipe everything left behind.
The New Space is split into two equal halves. Only one half is ever in use at a time—call them the active half and the empty half.
- New objects pile into the active half until it fills up.
- When it’s full, the cleanup runs. V8 engine checks which objects are still reachable (using the rule from the last section).
- It copies only those survivors into the empty half, packing them tightly together.
- The old half is now nothing but dead objects, so V8 engine wipes it clean in one stroke. The two halves swap roles, and the cycle repeats.
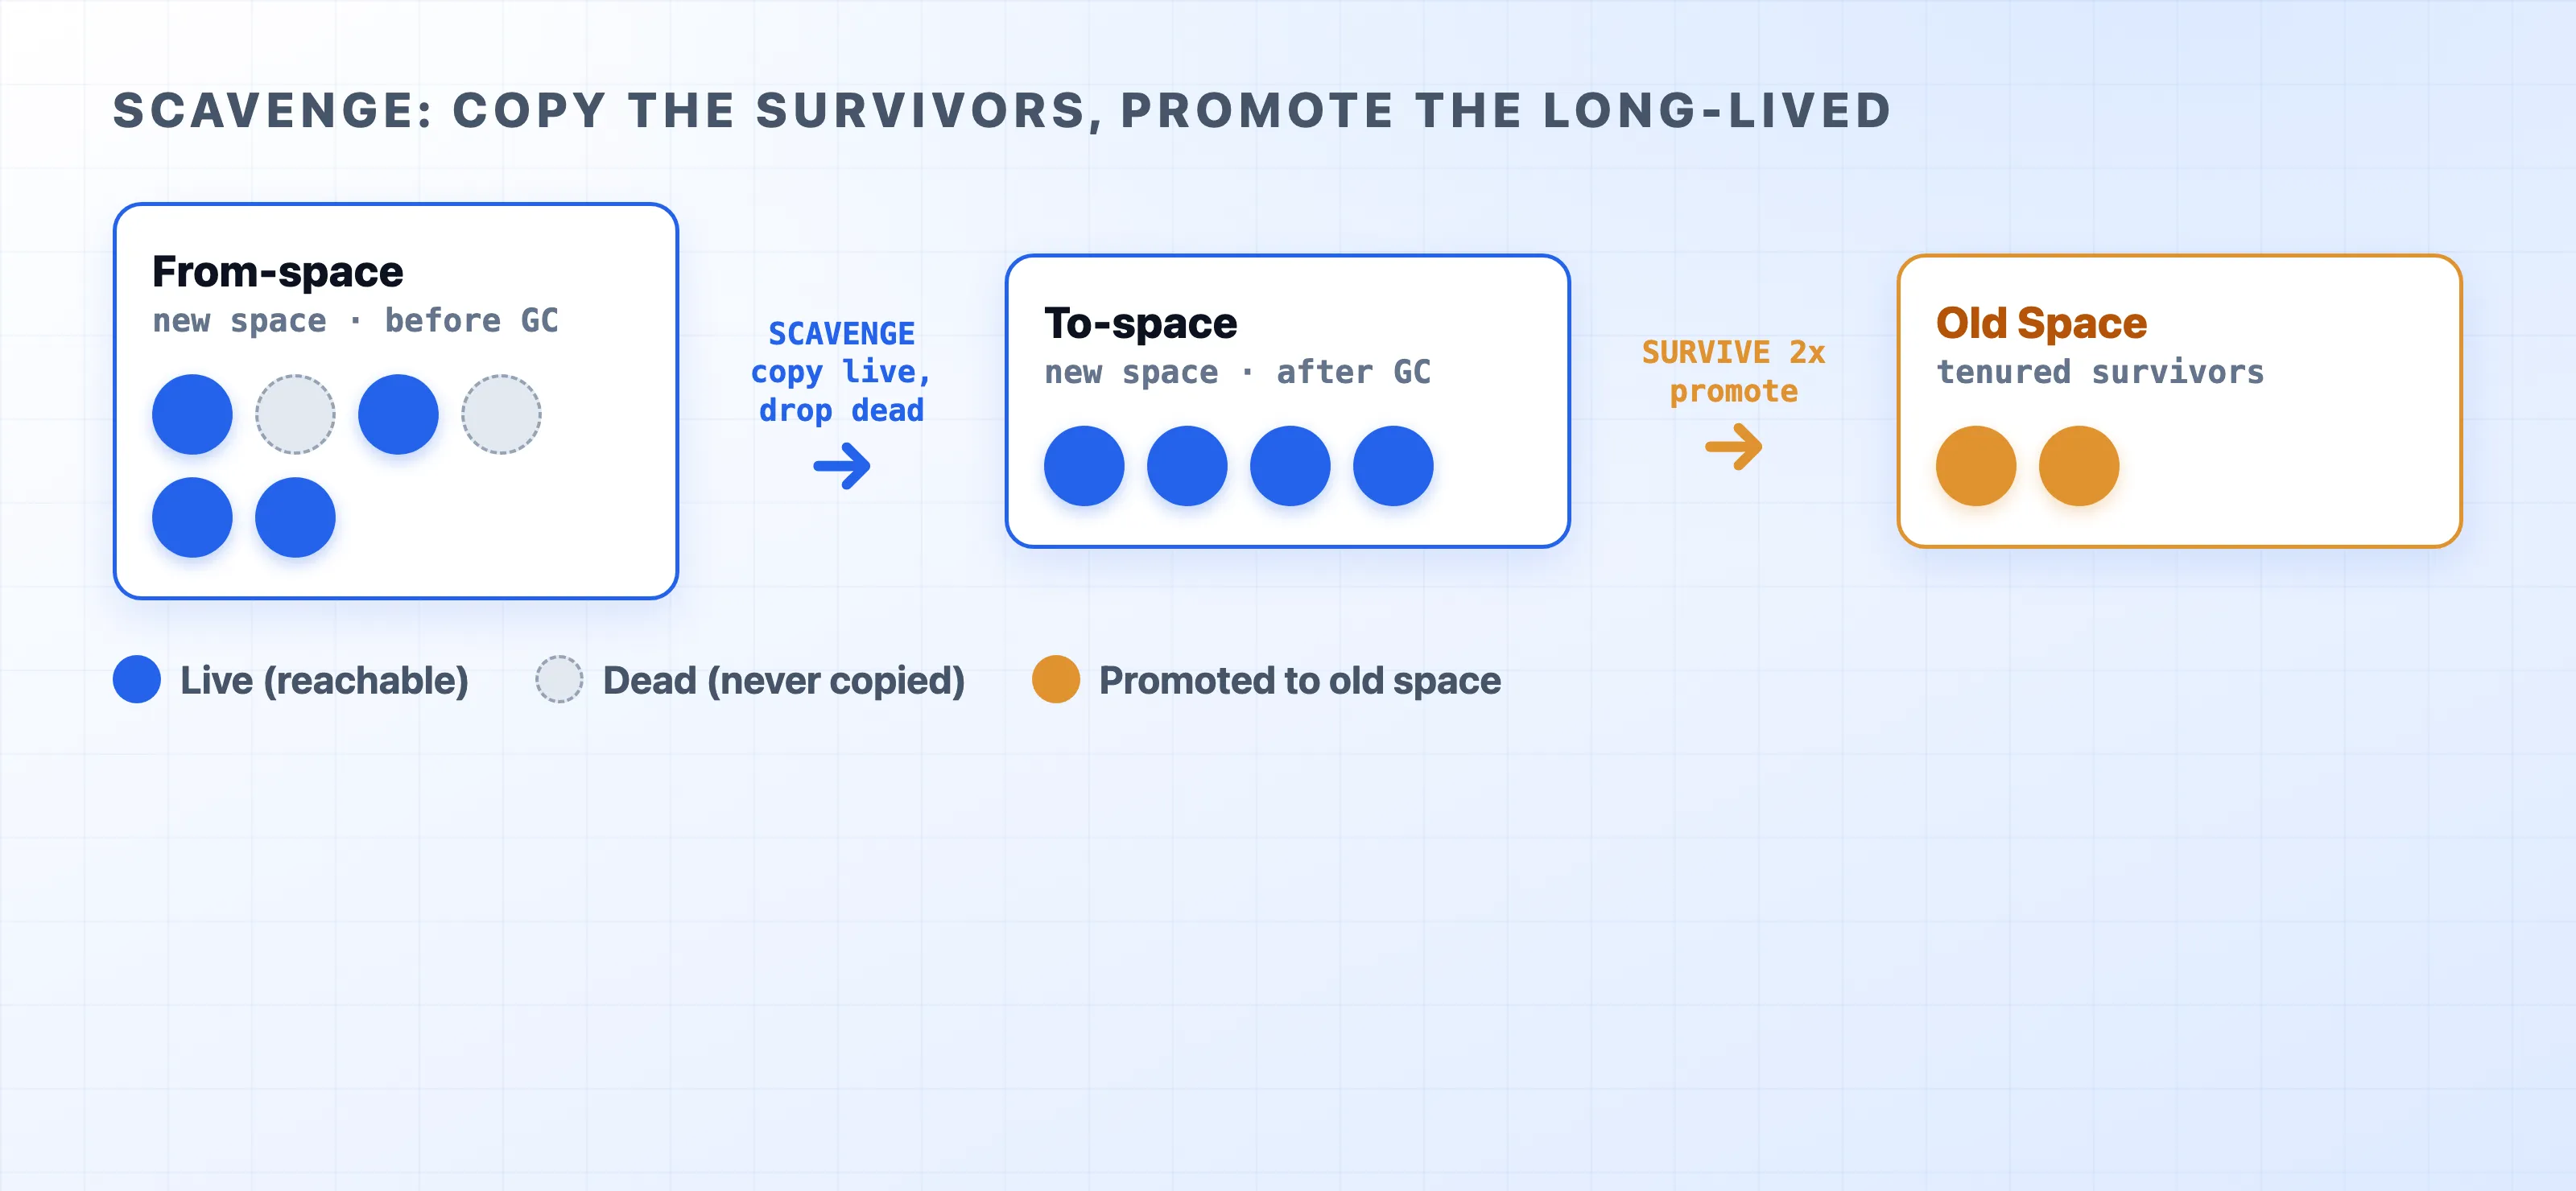
This is fast for one reason: V8 engine only touches the living objects. It never visits the dead ones one by one—it just throws away the whole half they were sitting in. Since most objects are already dead by the time the cleanup runs, there’s very little to copy.
If an object survives this a couple of times, V8 engine figures it’s probably here to stay. Rather than keep copying it back and forth forever, it promotes the object into the Old Space.
Mark-Sweep-Compact: The Deep Clean (Old Space)
Old Space is too massive to use the two-bucket copying trick. Copying gigabytes of data back and forth would grind your app to a halt. Instead, Old Space uses a three-step deep clean called Mark-Sweep-Compact:
- Mark: The collector starts at the “roots” of your app (like global variables) and traces every connection it can find. If it can reach an object, it marks it as “Alive.” If an object is completely disconnected, it gets marked as “Garbage.”
- Sweep: V8 engine sweeps through the memory and clears out all the unmarked garbage, leaving empty holes in your memory where the dead objects used to be.
- Compact: If memory gets too fragmented (like a bookshelf with random gaps between books), V8 engine slides all the living objects together into a neat row, creating a large block of free space for new data.
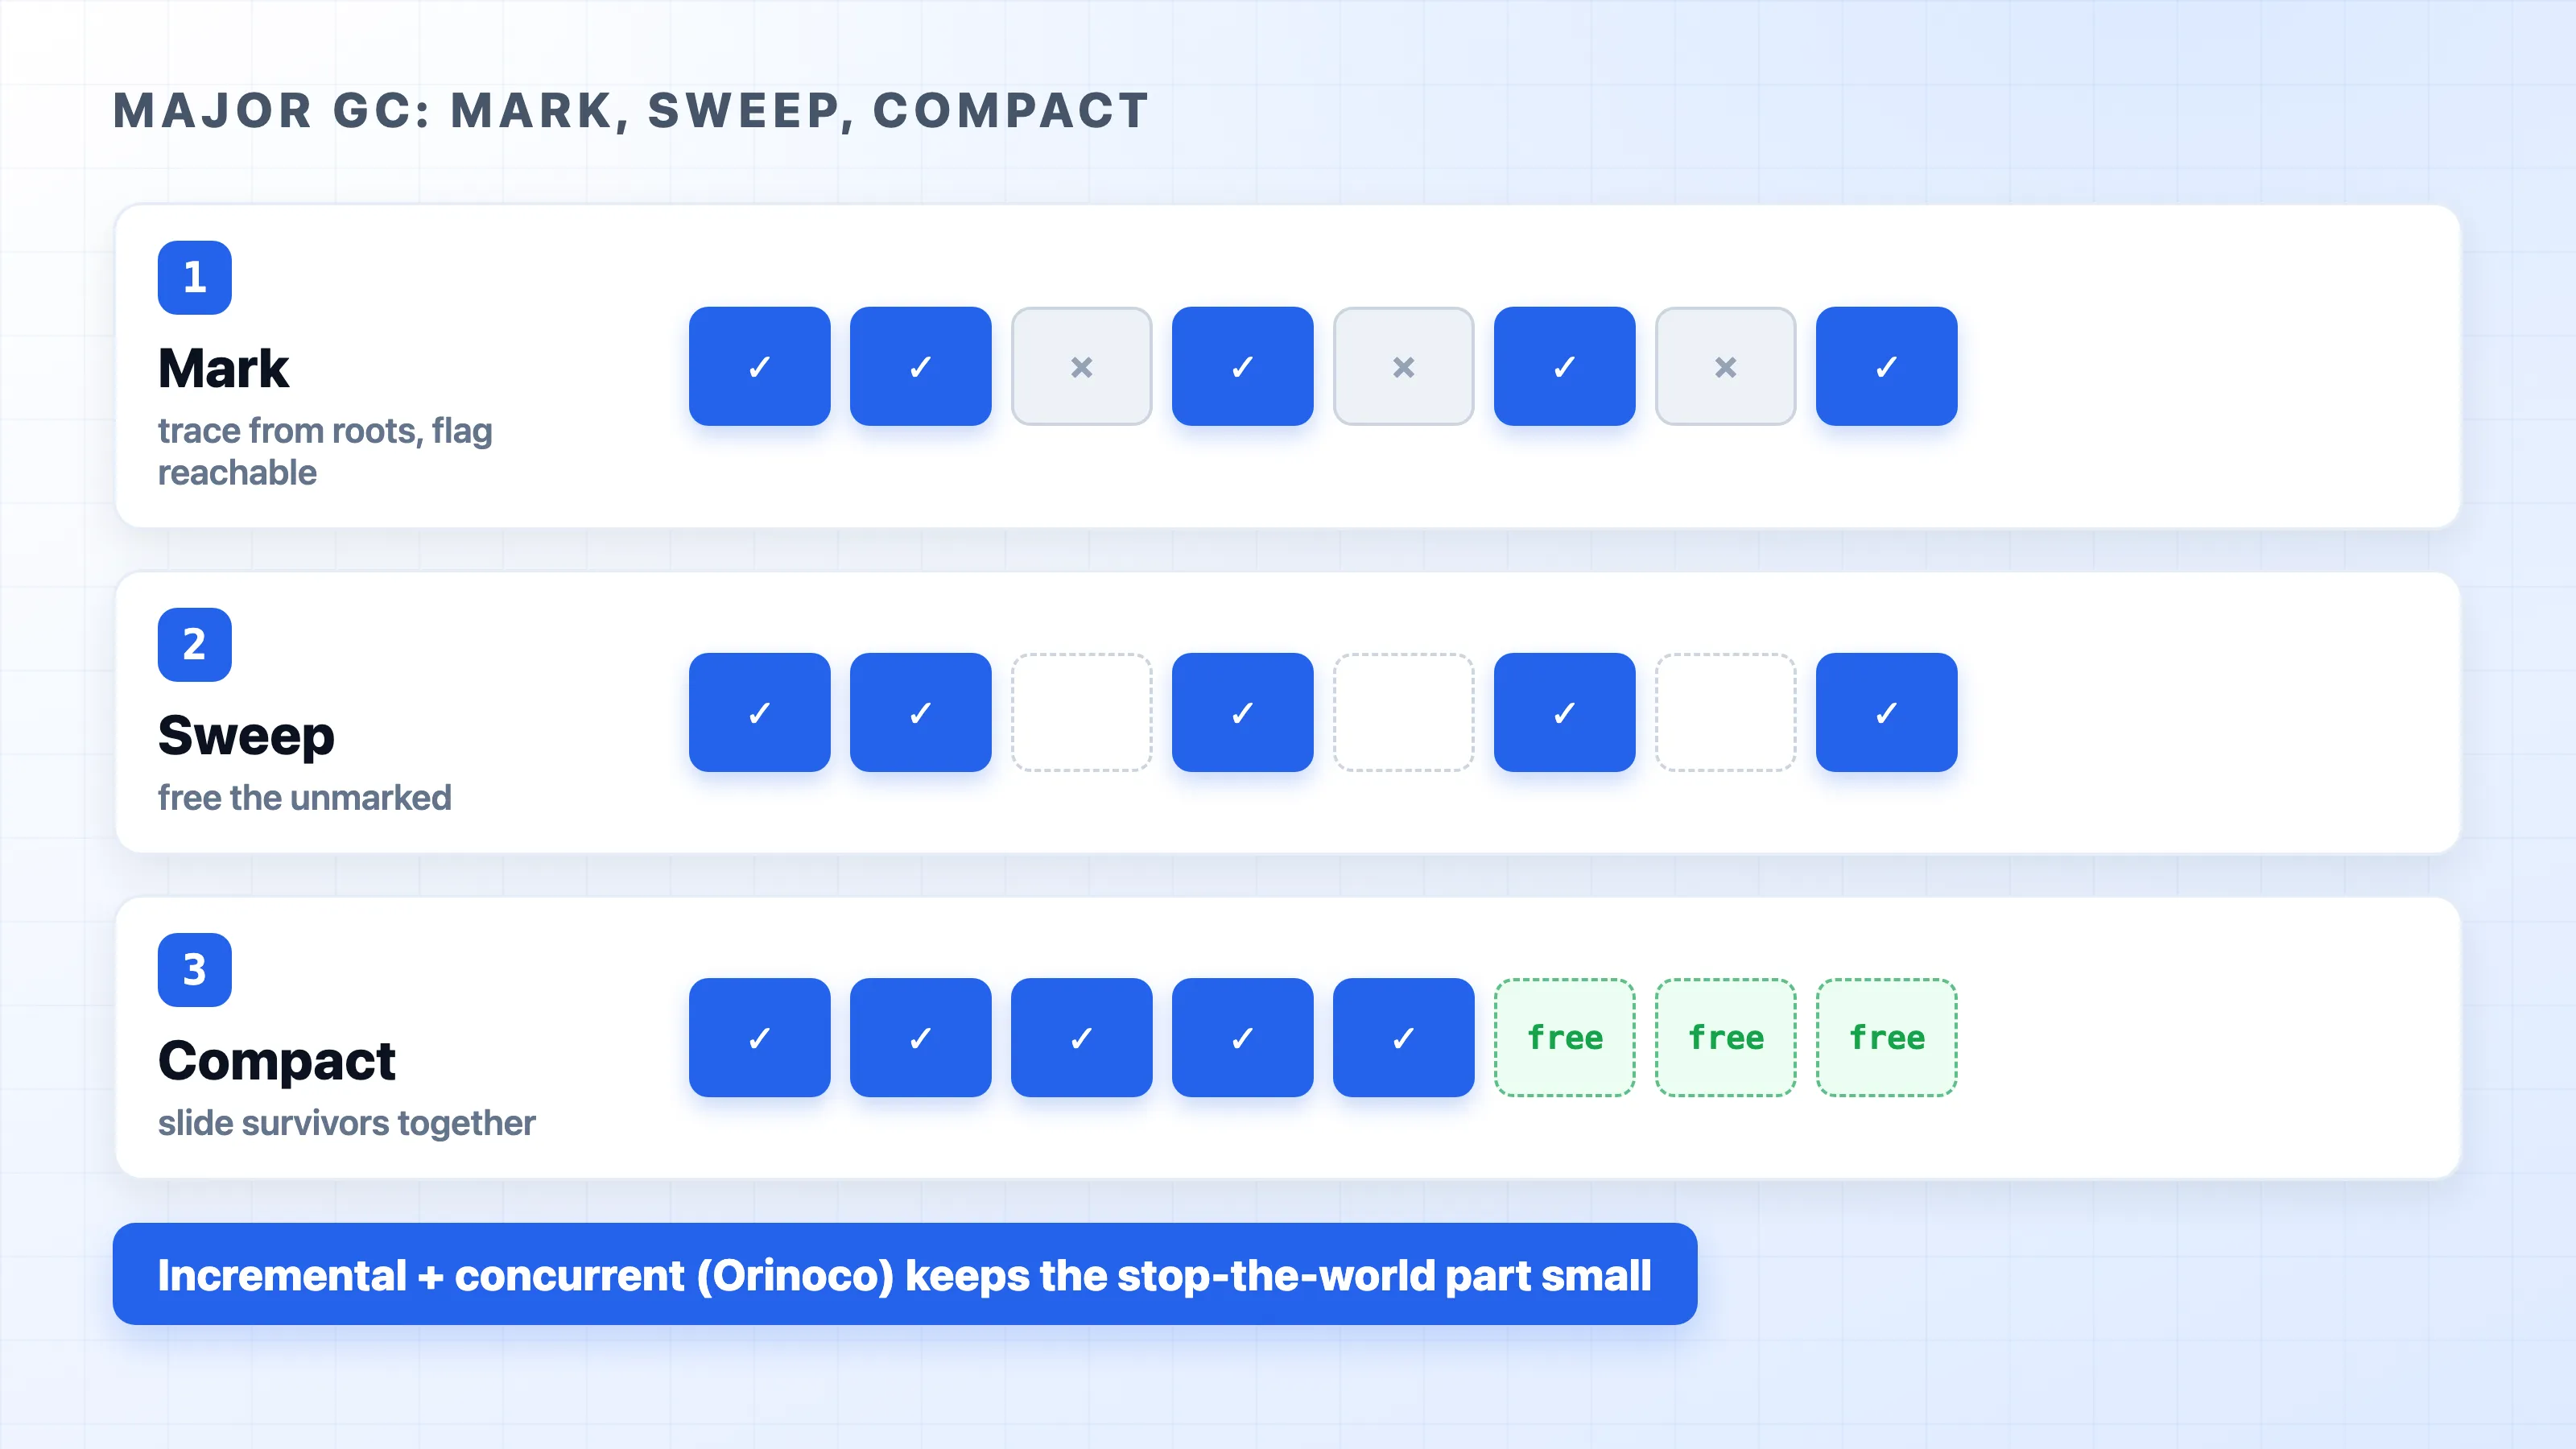
In the past, this deep clean required a long “stop-the-world” pause. Today, V8 engine uses a modern collector named Orinoco. Orinoco does a lot of this heavy lifting in the background while your code is still running, keeping those freezing pauses as short as possible.
Why Garbage Collection Makes Your App Slow
First, when does a cleanup even run? It’s not on a timer. The V8 engine collects when it needs space—when a part of the heap fills up. Every object you create uses a little more room, so the more your code allocates, the sooner the next collection fires:
- A New Space cleanup runs whenever the small New Space fills with new objects. Under busy traffic this happens many times a second.
- An Old Space cleanup runs much less often—only when Old Space has grown enough to be worth a full sweep.
You can’t predict the exact moment, and you don’t control it. The V8 engine decides based on how much you’ve allocated. That’s the catch: a collection can land at any time, including in the middle of handling a request.
Whenever the V8 engine runs one of these cleanups with a “stop-the-world” pause, your event loop is blocked.
The New Space cleanups (the Scavenge) are so fast you’ll never notice them. But Old Space cleanups can take tens of milliseconds on a large codebase. If a user hits your API at the exact moment one of those pauses happens, their request gets stuck waiting.
If your app is holding onto too much data in Old Space, V8 engine has to scan more items, causing longer pauses and creating random latency spikes for your users.
Pro Tip: This is why running multiple workers with the cluster module is powerful. Each worker gets its own memory Heap. If Worker A freezes to clean up memory, Worker B can still instantly handle incoming traffic!
Common Memory Leaks (And How to Fix Them)
A “memory leak” in Node.js isn’t memory that V8 engine lost. A leak is memory that V8 engine wants to clean up, but can’t, because your code is accidentally still holding onto it.
Here are the most common culprits:
1. Caches with No Limits
If you save user data to a Map but never delete old entries, it will grow infinitely until it crashes your server.
Bad (Leaky Cache):
const cache = new Map();

export function getProfile(userId, build) {
  if (!cache.has(userId)) {
    // This cache grows forever!
    cache.set(userId, build(userId));
  }
  return cache.get(userId);
}
Good (Bounded Cache):
const cache = new Map();
const MAX = 1000; // Limit the cache size!

export function getProfile(userId, build) {
  if (cache.has(userId)) return cache.get(userId);

  // If we hit the limit, delete the oldest item
  if (cache.size >= MAX) cache.delete(cache.keys().next().value);

  const profile = build(userId);
  cache.set(userId, profile);
  return profile;
}
2. Forgotten Timers and Event Listeners
If you start a setInterval or add an event listener (emitter.on(...)) but never clear it, V8 engine cannot clean up the callback function or any variables attached to it. Always run clearInterval or removeListener when you are done!
3. Overstuffed Global Variables
Variables attached to the global scope live forever. If you accidentally push per-request data into a global array, it will never be collected.
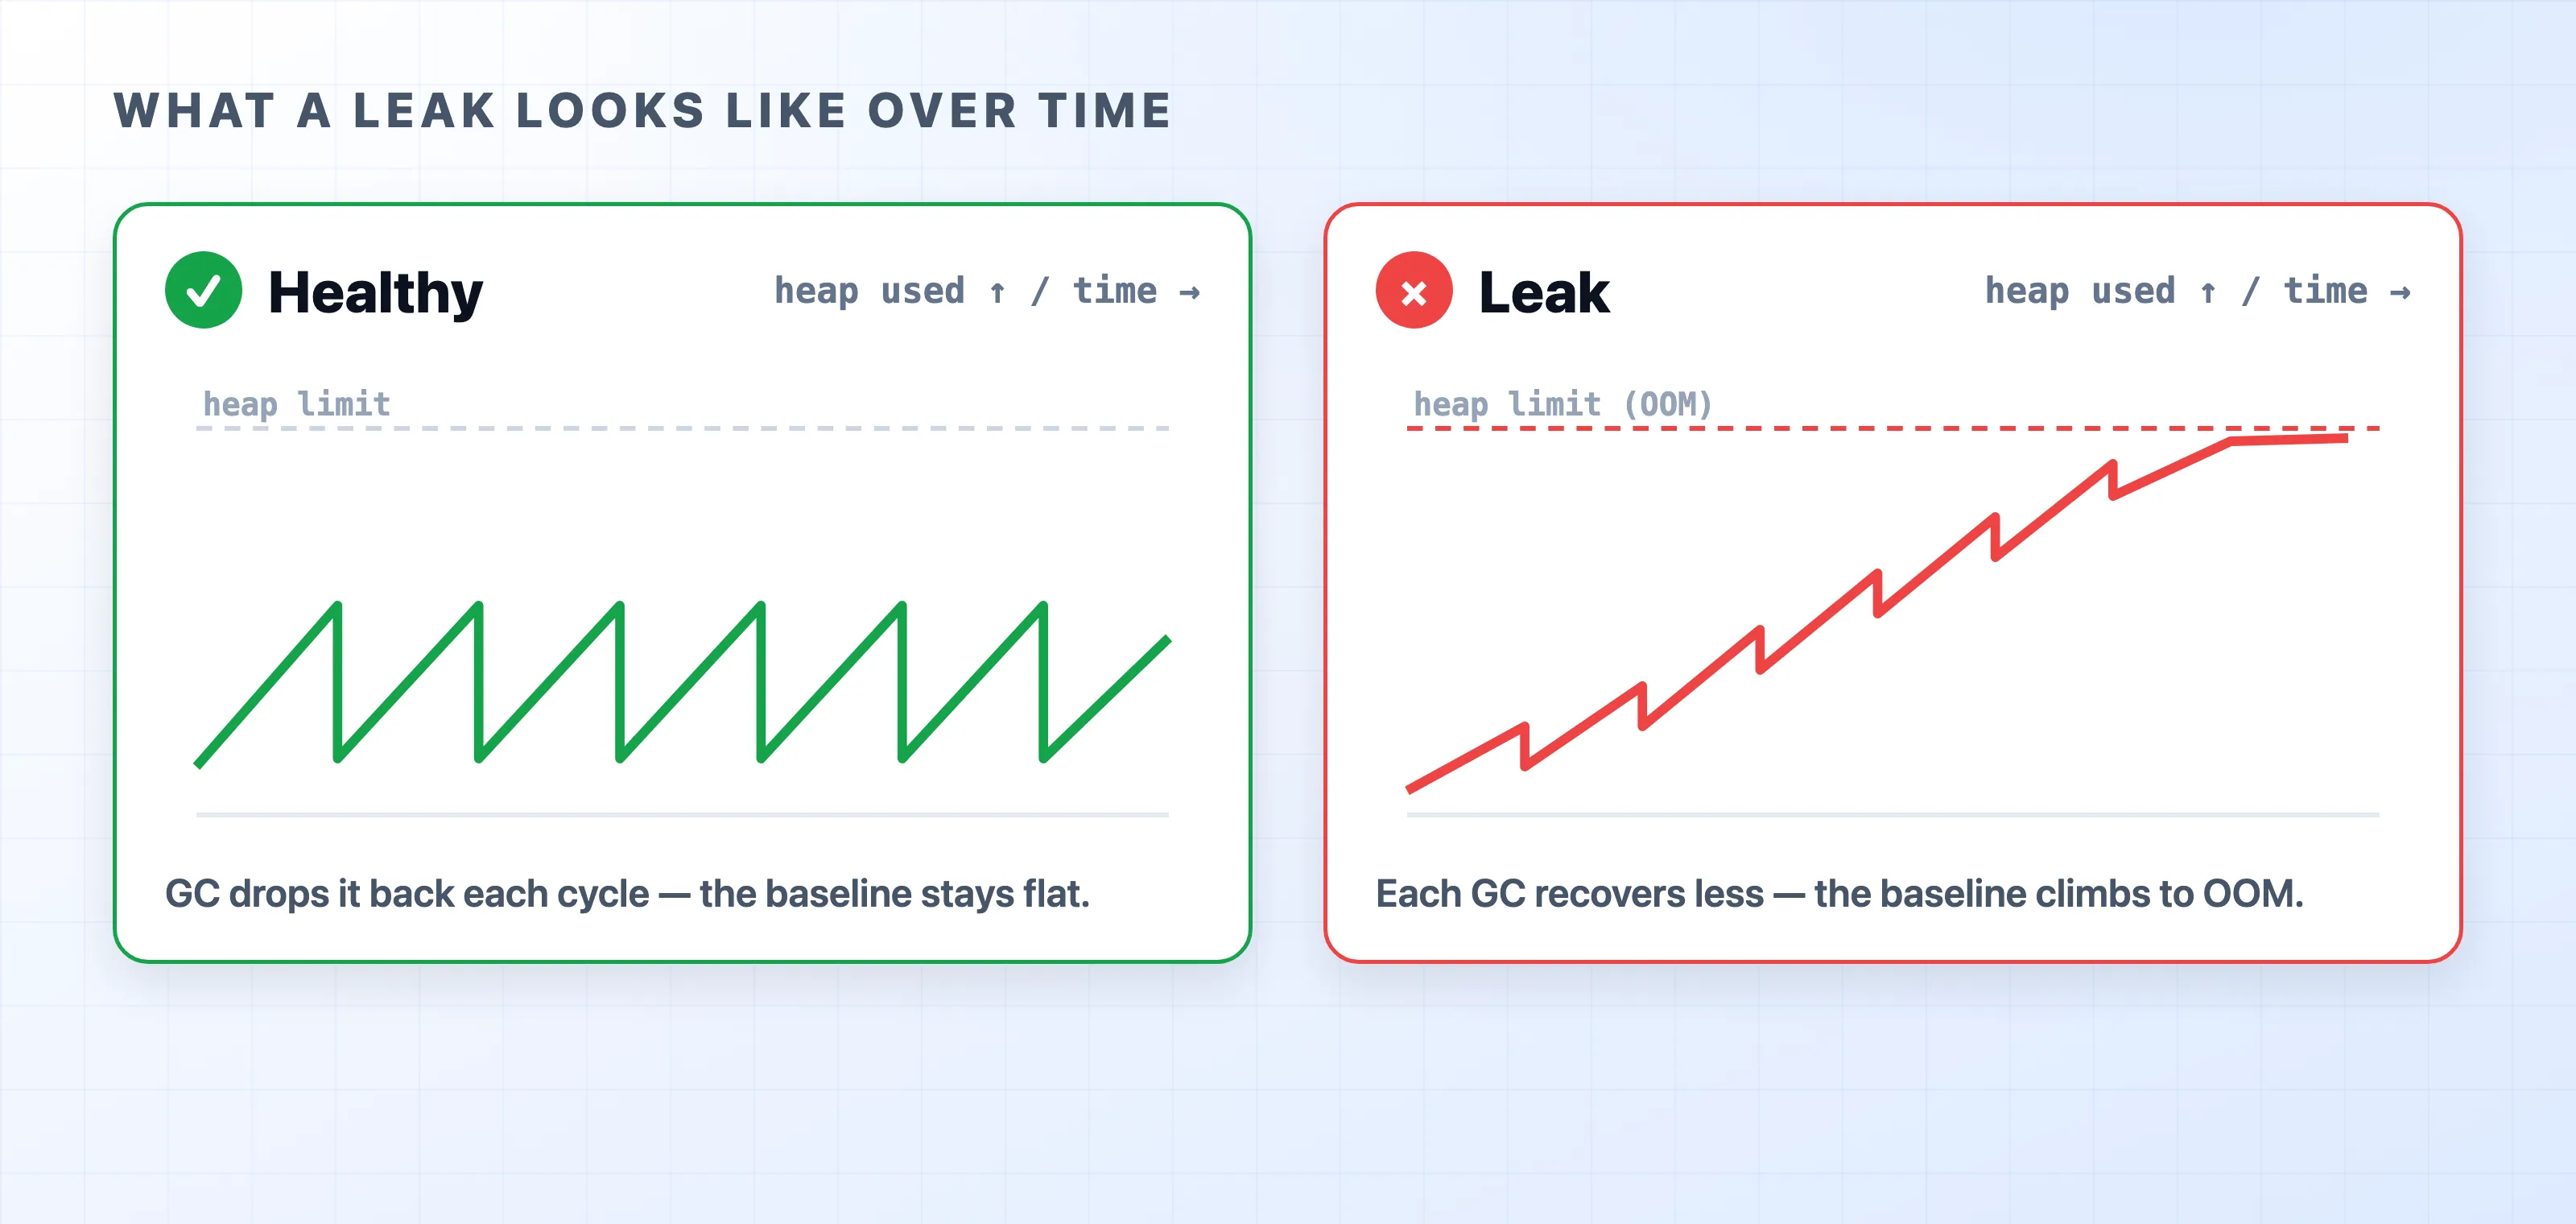
Look at the chart above. A healthy app looks like a sawtooth: memory goes up as you process data, then sharply drops when GC runs. A leaking app looks like a staircase: memory goes up, but the GC can’t clean it all up, so the baseline keeps climbing higher until the app crashes.
How to Spot a Memory Issue
You don’t have to guess if you have a memory leak. Node.js gives you excellent tools to see exactly what is happening:
- The Quick Check (
--trace-gc): Start your app withnode --trace-gc app.js. Every time a cleanup happens, V8 engine will log a message to your console telling you how much memory was freed and how long the pause took. - The Deep Dive (Heap Snapshots): Start Node.js with
node --inspect app.js, open Google Chrome, and go tochrome://inspect. From the Memory tab, you can take a “Snapshot” of your heap. Take one snapshot, run your app for a bit, then take a second snapshot. You can compare the two to see exactly which objects are refusing to die! - In-Code Monitoring: You can use the built-in
perf_hooksmodule to log your GC pauses to your metrics dashboard (like Datadog or Grafana).
import { PerformanceObserver, constants } from "node:perf_hooks";

const kind = {
  [constants.NODE_PERFORMANCE_GC_MINOR]: "minor (Scavenge)",
  [constants.NODE_PERFORMANCE_GC_MAJOR]: "major (Mark-Sweep-Compact)",
};

// This logs every time a garbage collection happens
const observer = new PerformanceObserver((list) => {
  for (const entry of list.getEntries()) {
    console.log(`${kind[entry.detail.kind]} took ${entry.duration.toFixed(2)}ms`);
  }
});

observer.observe({ entryTypes: ["gc"] });
Should You Change the Default Settings?
Node.js and the V8 engine pick a default old-space limit based on the runtime version and how much memory the machine actually has. You can override it with the --max-old-space-size=<MB> flag (e.g., node --max-old-space-size=4096 app.js to allow 4GB).
But beware: raising the limit does not fix a memory leak. If you have a leak, giving the process more memory just means it takes longer to crash. Worse, as memory fills toward the limit, the V8 engine spends more and more time running garbage collection—so your app gets slower right before it finally dies.
Only raise --max-old-space-size when the process genuinely needs to hold more live data on purpose—a large in-memory dataset, or a cache you’ve already capped that simply needs room. Otherwise, trust the defaults; they are chosen well.